Low Cost Colorimeter
A colorimeter is a device that measures the absorbance of a particular wavelength of a solution. In chemical applications this information is useful for non-invasively determining the concentration of a solution and monitoring the progress of a reaction. For my high school digital electronics final project, I decided to build one myself using off-the-shelf components.
The term “colorimeter” normally refers to a device that measures particular visible wavelengths (i.e. particular colors). Ultimately, the goal was to recreate a piece of professional laboratory equipment that could be used in my home lab to easily monitor the concentration of a solution.
Background Link to heading
White light is composed of a spectrum of colors, meaning that it consists of a mix of mulitple wavelengths. When it passes through a colored solution, some wavelengths are absorbed while other wavelengths are transmitted. The transmitted wavelengths are what give colored solutions their color. For example, a red solution appears red when white light is shone onto it because all the blue/green wavelengths are absorbed, leaving only the red wavelengths.
The basic idea of a colorimeter is that the amount of light absorbed by a colored solution is directly proportional to the solution’s concentration and the distance that the light travels in the solution. This is expressed succinctly through the Beer-Lambert Law,
\[A = \varepsilon bc\]where \(A\) is the absorbance, \(\varepsilon\) is the molar absorbtivity (the proportionality constant), \(b\) is the path length, and \(c\) is the concentration in moles/L. The definition of absorbance is given by
\[A = \log \frac{P_0}{P}\]where \(P_0\) is the input power and \(P\) is the output power of the light after passing through the substance. Like many other laws, Beer’s Law is an approximation and tends not to hold for solutions that are too concentrated or too dilute. With this in mind, we can begin designing our device.
Design Link to heading
Light Source Link to heading
The wavelengths that are relevant to this project lie within the visible spectrum. Therefore, the colorimeter will use a visible light LED (about 380nm - 700nm). For colorimetry to be effective, the wavelength used must be one that is absorbed by the colored solution. For example, as discussed previously, a red solution does not absorb red light, so using a red LED would yield very poor resolution. We would instead want to use the complement of the color (i.e. green). This means the colorimeter would be most effective if it could measure at multiple wavelengths to accomodate solutions of many different colors. An RGB LED was perfectly suited to this task.
Sensor Link to heading
The sensor should be able to take measurements in the red, blue, and green channels separately. The Sparkfun RGB light sensor worked perfectly. It uses the ISL29125 which has one sensor for each color channel, two brightness modes, and an IR filter which is helpful for our use case.
Calibration Link to heading
The definition of absorbance given above requires knowledge of the input power of the light before entering the solution. A simple solution used by most colorimeters is to conduct a baseline calibration. The user inserts an optically transparent solution (e.g. water) into the sample well, and this reading is used as the baseline to compare other measurements against. This baseline measurement can simply be stored in memory until the user calibrates again.
Processor Link to heading
An Arduino Uno was provided by the class for the project. It will drive the LED display as well as communicate over a SPI bus with the light sensor.
Power Link to heading
The ISL29125 runs on 3.3V logic while the Arduino is a 5V device. It is necessary to use a logic-level convertor. Sparkfun also sells a convenient bi-directional logic level converter. The entire device is powered from an AC adapter that outputs 9V. An LM7805 and LD1117V33 regulated the 9V down to 5V and 3.3V respectively.
Display Link to heading
The output is displayed on a 4-digit seven-segment display. To save pins, a seven-segment decoder such as the 74LS47 can be used to drive the display.
Enclosure Link to heading
The measurements will be skewed by ambient light, so an opaque enclosure is necessary to ensure that the measurements are taken in a controlled setting. I chose to laser cut a housing out of black acrylic.
Electronics Link to heading
The entire circuit was split into three main sections. (This project was completed in 2016, but I redrew the schematics for this writeup in 2018, hence the time stamps on the schematics.)
Power and Inputs Link to heading
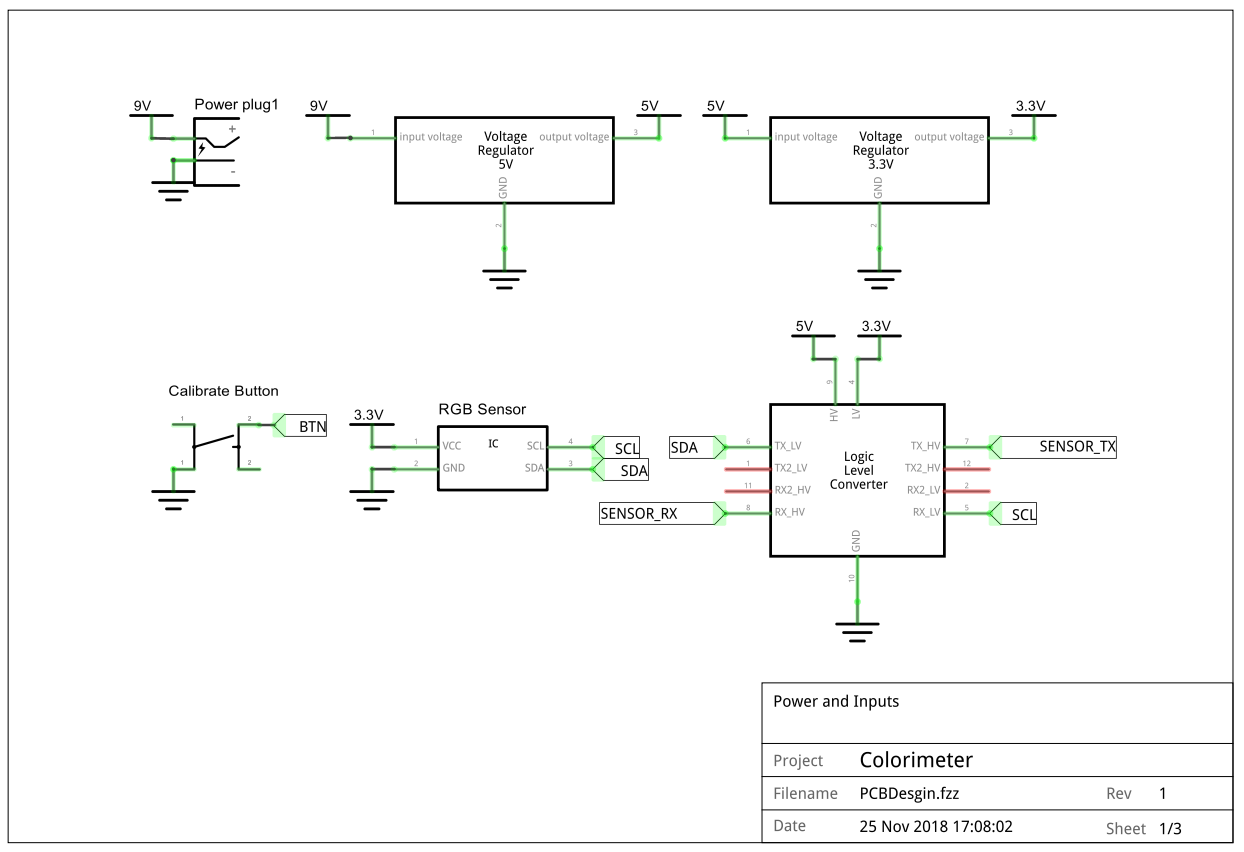
The entire device was powered from a 9V wall adapter. The two voltage regulators provided 5V and 3.3V rails for the remaining components. The schematic shows a Logic Level Converter with Tx and Rx pins, but if the Sparkfun bi-directional logic level converter linked above is used, then each channel can handle Tx and Rx without any directionality concerns. This just happened to be the part that Fritzing had in its library.
LED Control Link to heading
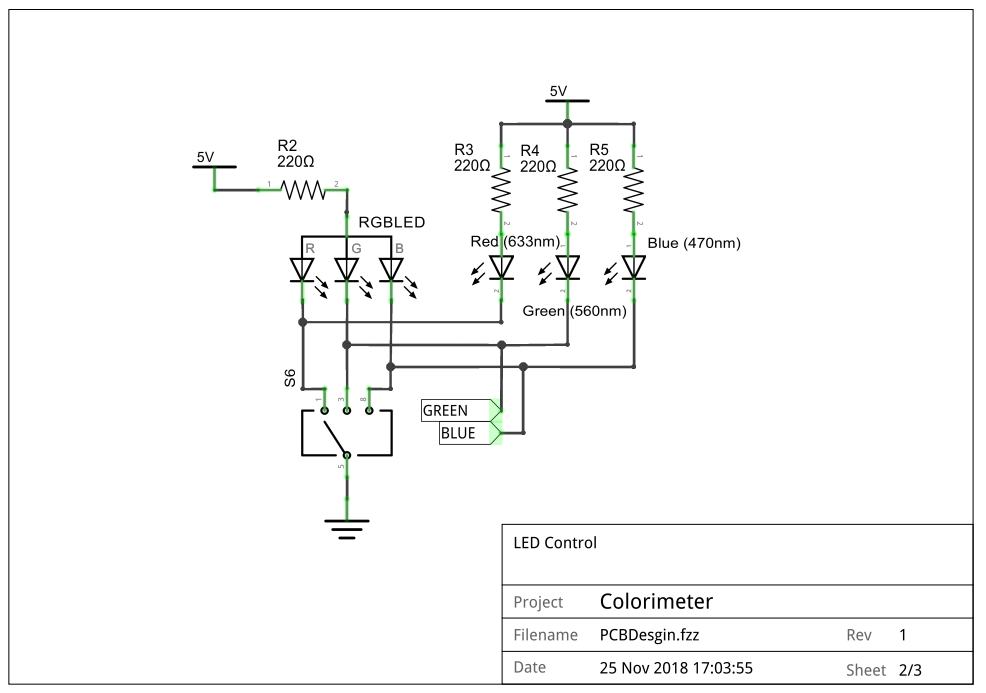
There are two sets of LEDs in this project: the colorimetry light source LEDs and the indicator LEDs. The indicator LEDs (connected to R3, R4, and R5) are mounted to the front panel to show which wavelength is on inside the device. The RGB LED is the light source that is mounted within the device and provides the light source for the actual measurement. The GREEN and BLUE signals are fed into the Arduino so that it can determine which wavelength the device is set to (since each wavelength requires a different command to be sent to the sensor). The current limiting resistor values for the indicator LEDs (R3, R4, and R5) were also adjusted during construction to make the LEDs appear approximately equally bright.
Arduino and Display Link to heading
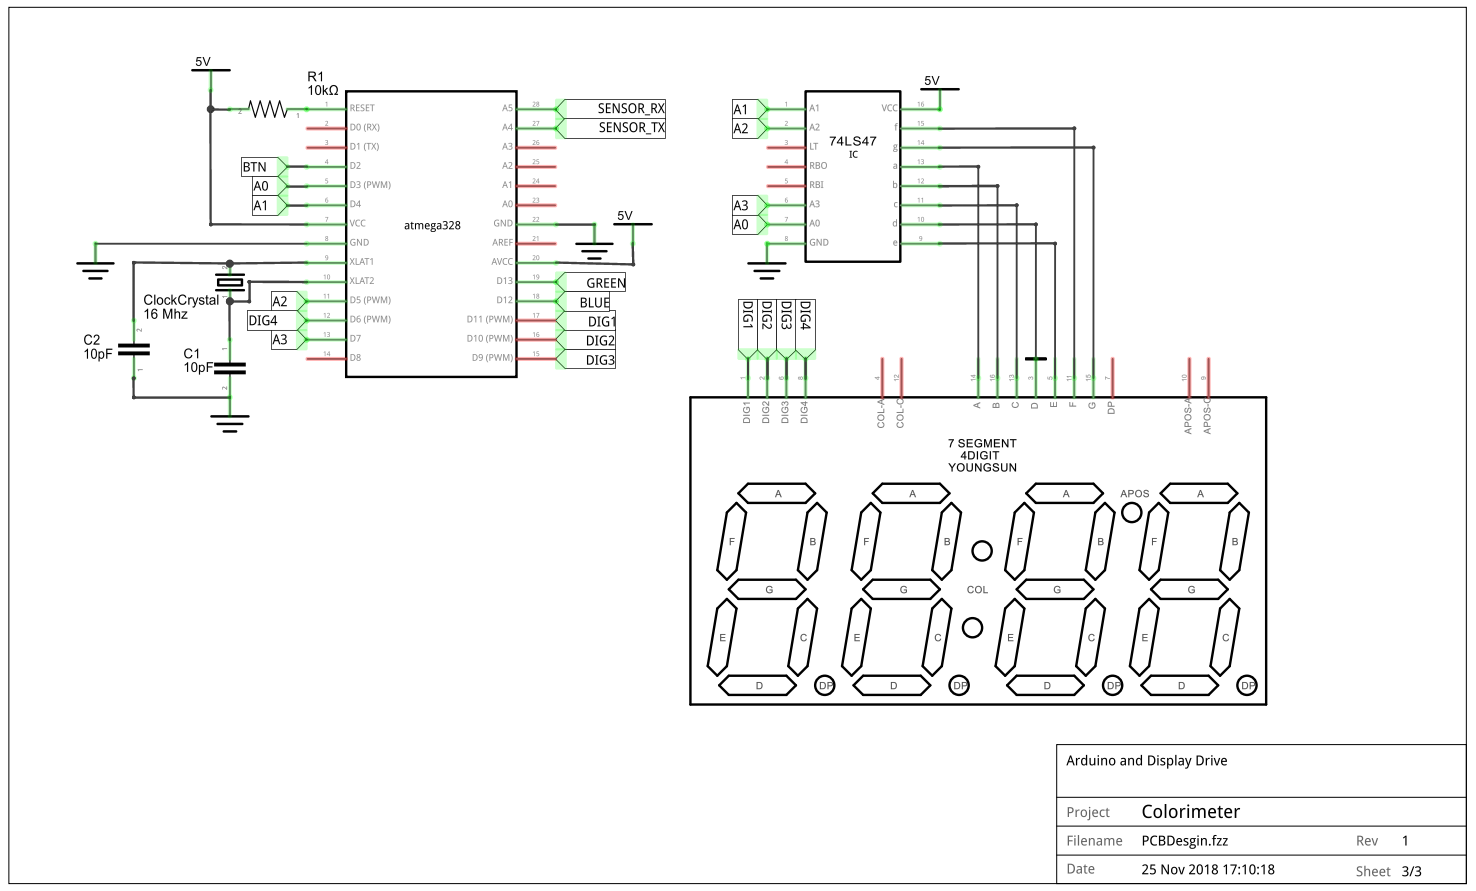
One of the requirements for this project was to remove the Atmega IC from the Arduino board in order to create a stand-alone product. Additional circuitry was added to pins 1, 9, and 10 of the Atmega328 to replace the functionality originally provided by the Arduino board. This includes the 10k pullup resistor for the reset pin and the 16MHz clock signal. The 74LS47 is not strictly necessary, but it makes it easier to drive the seven-segment display. A0-A4 represent the number to be displayed in binary, and DIG1-DIG4 select which digit of the display is lit.
Code Link to heading
The code can be found on Github. The final version of the code is located in the MainCode.ino sketch while the other files were used to incrementally test each of the components. The code is fairly standard and takes advantage of pre-existing libraries for the components in this project. A few notable points:
- Pins 2, 12, and 13 have their internal pullup resistors enabled since they are sensing the button press and which LED is turned on.
- Instead of constantly polling pin 2 to check for a button press, an interrupt service routine (ISR) is used.
The Arduino Uno provides two.
We will use ISR 0 which is mapped internally to pin 2.
Note that interrupts operate on a hardware level and thus cannot be remapped in software.
For a full discussion, see Nick Gammon’s notes on interrupts.
At the time of this project, I was not aware of this hardware limitation and thus hard-coded this value into my code when I used the
attachInterrupt(0, pin_ISR, FALLING);command. This relies on pin 2 being attached to interrupt 0 which is not true for any Arduino boards besides the Uno and Ethernet. As suggested in the documentation, it would have been more generalizable to useattachInterrupt(digitalPinToInterrupt(2), pin_ISR, FALLING);which will map the correct digital pin to the interrupt based on the board type. However, since this code was only going to be run on an Atmega328, this is fine. - The 4-digit display is multiplexed This means that instead of using one pin for each segment to turn it on, there are seven pins corresponding to seven segments along with four pins to select which digit is being lit up. This uses only 11 pins instead of 28. (This is just an approximate calculation as there are also decimal points, ground pins, etc.) The microcontroller is repsonsible for switching rapidly between the various digits to create the illusion of all four segements lighting up simultaneously.
Enclosure Link to heading
Because this project relies on sensitive measurements of light intensity, it is necessary to have a proper enclosure in order to get accurate results. Furthermore, because the device uses the clear calibration sample as a reference point, it is important to ensure that the environment is consistent between samples. I designed a custom enclosure that can be laser cut out of opaque black acrylic to isolate the measurement chamber and house all the components in a rigid setup. This ensures that the sample is always the same distance from the light source, perpendicular to the beam, etc.
Cuvettes were used to hold the samples during the measurements. Cuvettes are small, transparent containers shaped like tall rectangular prisms that are designed to hold samples for colorimetry and various other types of spectrometry. They have two polished faces which have their inner walls precisely 1 cm apart. This allows for a constant path length between the samples. The disposable cuvettes I used were purchased online in a pack of 100 for about $14. (As with most lab equipment, there exist vastly more expensive versions such as those made of fused quartz.)
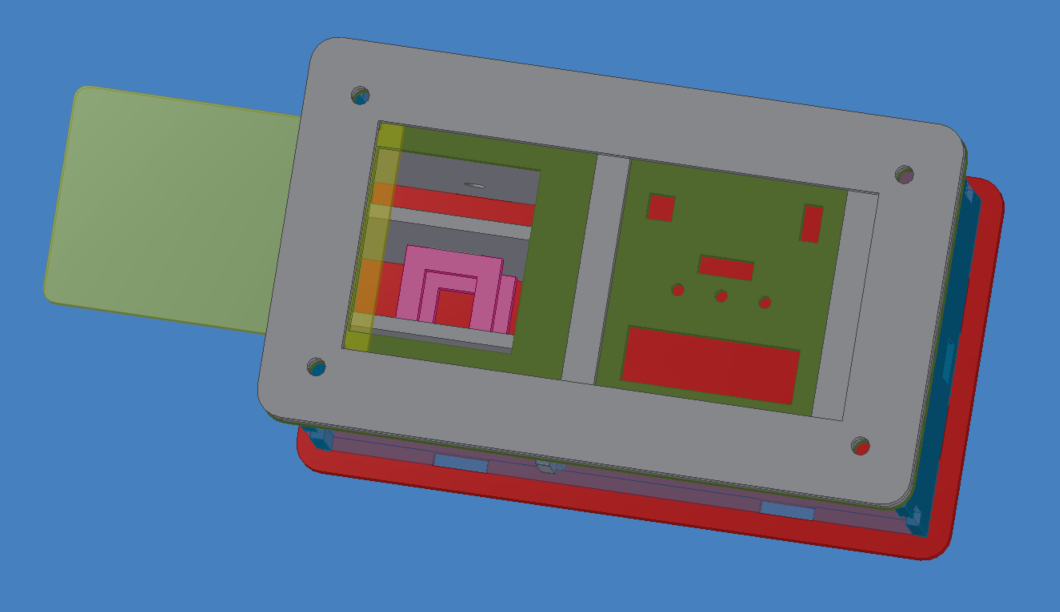
The following images show the final enclosure design. The walls are transparent in the images to show the internal details.
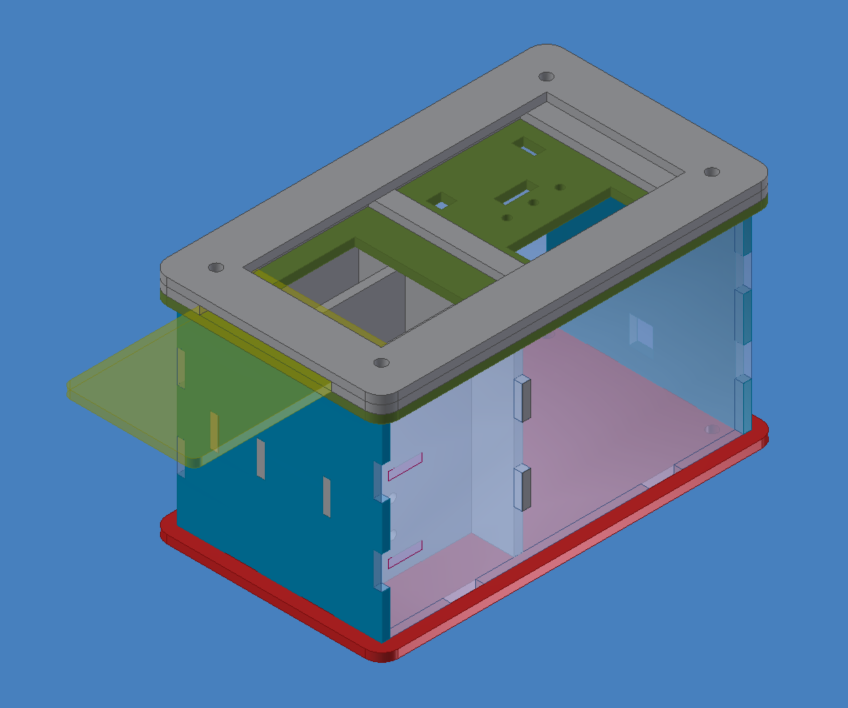
Back view: The case is divided into two sections. The left section is the measurement chamber that contains the source LED and the cuvette holder. The right section houses the electronics. The yellow piece near the top is a sliding door that is closed when the measurement is taken. The green panel has cutouts for the on/off switch, calibration button, indicator LEDs, wavelength selection switch, and the display.
Top view: The two pink pieces form the cuvette receptacle. The four holes in the corners allow for screws to be secured into 3-inch metal standoffs that hold the entire case together.
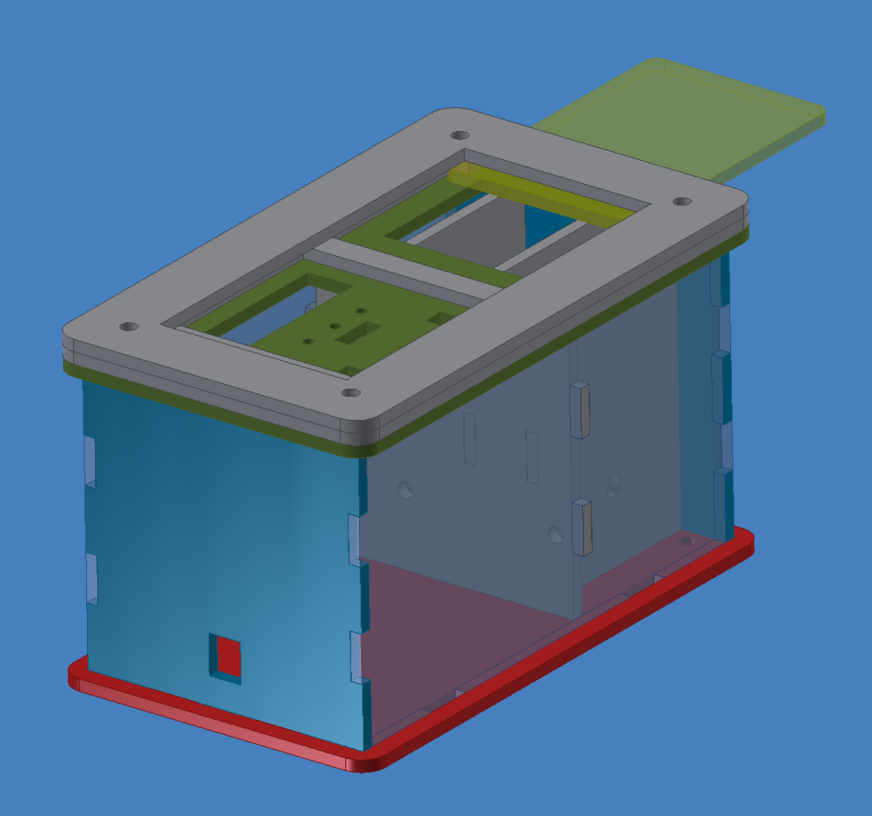
Front view: The rectangular hole is the mounting point for a standard power jack that connects to a 9V wall adapter. Circular holes are visible on the vertical walls inside the box. These are for wires to pass between the measurement area and the electronics area. The hole on the far gray wall is the mounting point for the RBG LED.
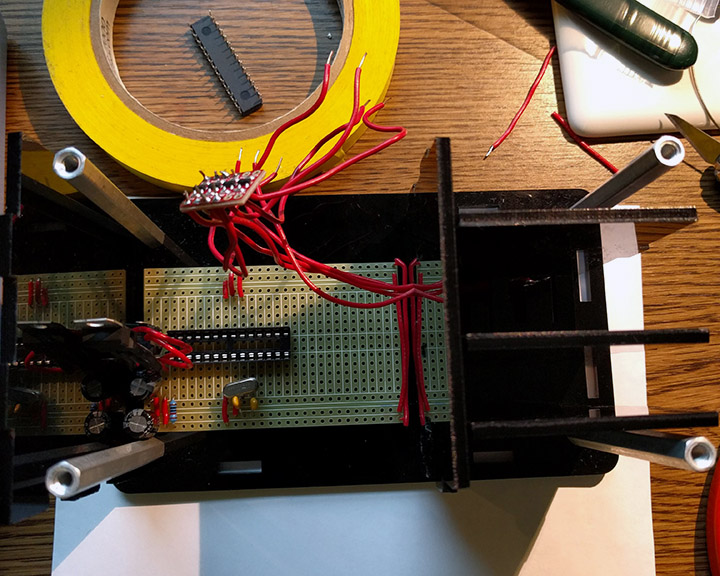
Top view during the build process. Visible components include the 7805, clock crystal, capacitors for the Atmega328, and the bi-directional logic level converter. The four metal standoffs in the corners hold the entire box together.
Results Link to heading
Final Device Link to heading
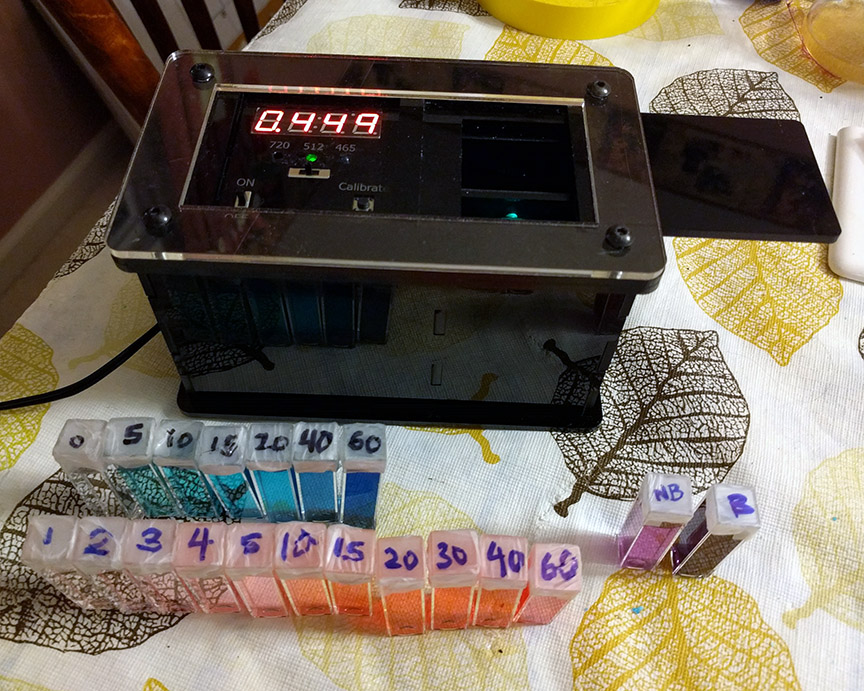
Final device on the green (512nm) setting with the lid open. The cuvettes in front hold the test samples.
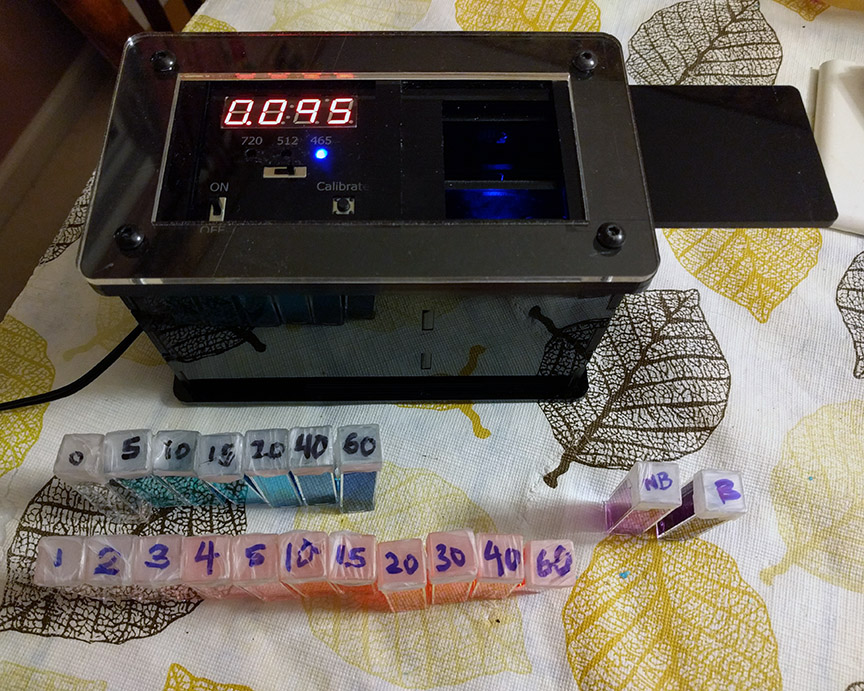
Colorimeter on blue (465nm) setting.
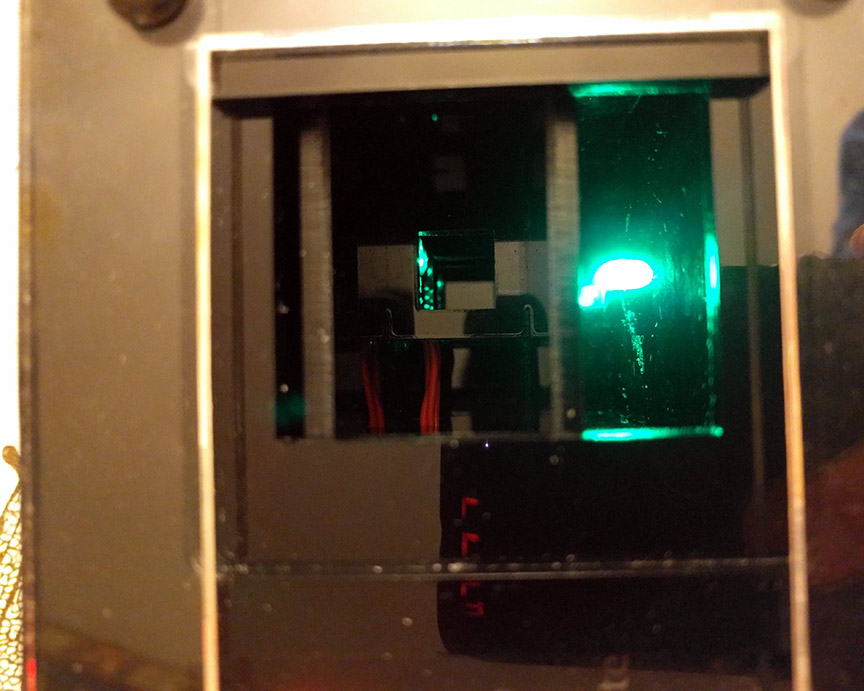
A view of the sample well. The red wires lead to the light sensor which is illuminated by the green light source and is just barely visible in this photo.
Accuracy Link to heading
The colorimeter was tested with some food coloring that was diluted down to set amounts indicated by the numbers on the cuvettes. Red and blue test samples were created to test the 512nm and 720nm absorbance settings respectively. The results are shown below.
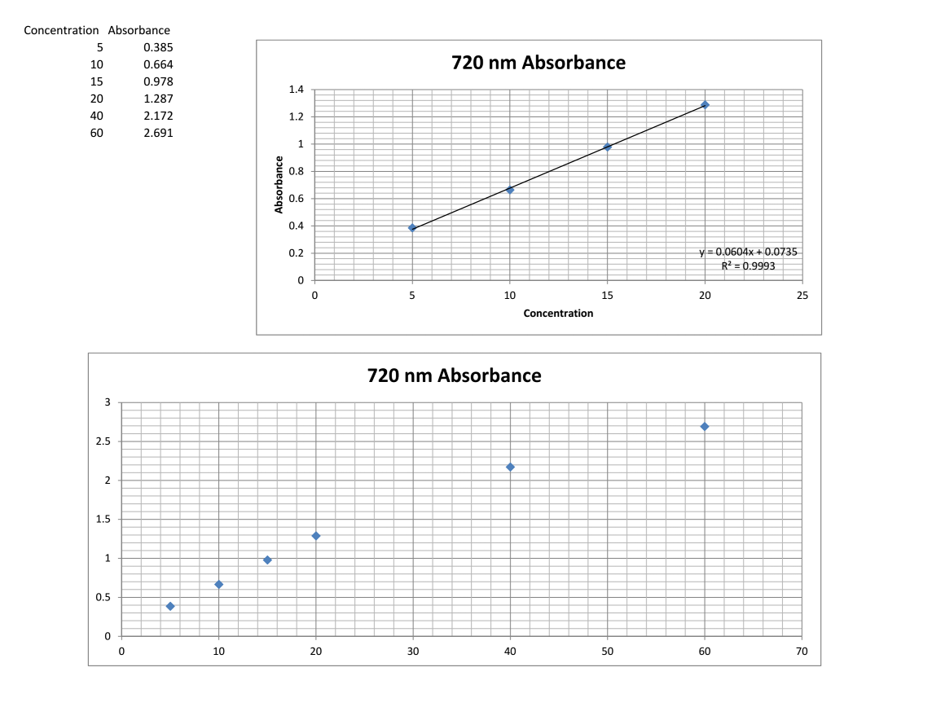
720nm calibration data. The first graph shows the linear regression performed on the linear portion of the absorbance graph (i.e. before the linearity of Beer’s Law breaks down).
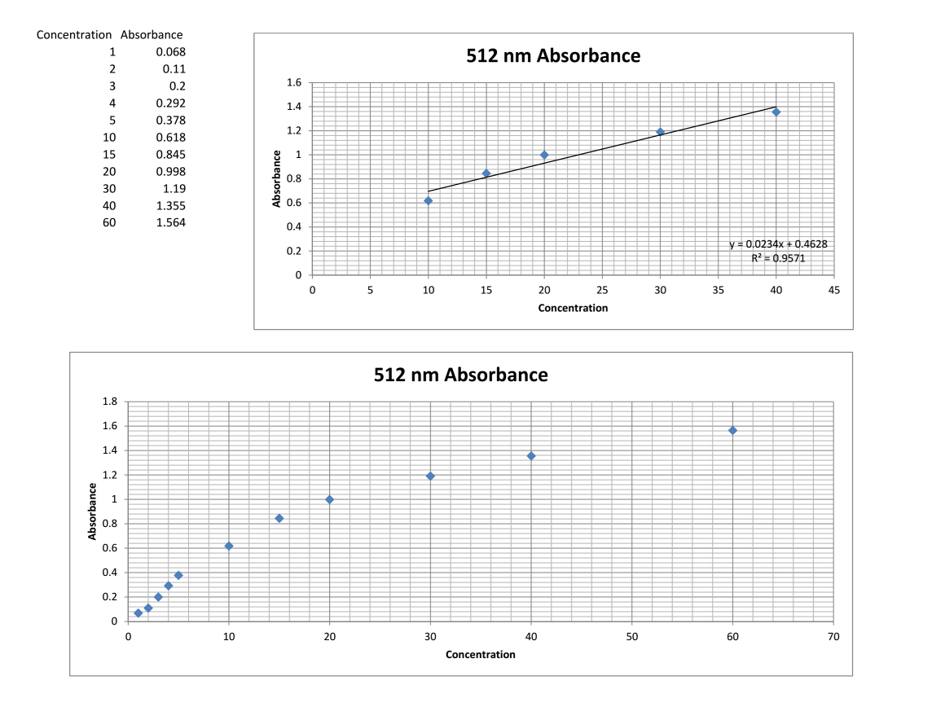
512nm calibration data.